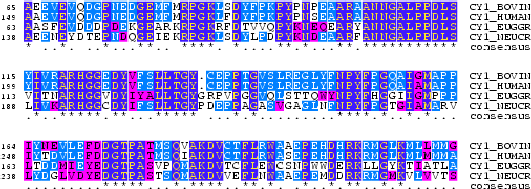
When we search for homologies, we want to find sequences that have related function and are perhaps but not necessarily evolutionary related. In general we want to identify the functional domains of an unknown sequence using sequence similarity to other sequences and infer some a function.
It is important to distinguish between local and global alignment:
The dynamic programming algorithms for sequence alignments provide the right answer to this problem but are computationally expensive to be effective when searching a database with thousands of sequences.
BLAST (Basic Local Alignment Search Tool) is an algorithm for comparing biological sequences, such as the amino-acid sequences of different proteins or the DNA sequences. It is one of the most widely used bioinformatics programs, probably because it addresses a fundamental problem emphasizing speed over sensitivity. This emphasis on speed is vital to making the algorithm practical on the huge genome databases currently available. More recent algorithms can be faster, but they are all based on heuristics similar to those of BLAST. developed where the search is made much faster by using heuristics. BLAST is one of these methods. It is important to remember that BLAST is a local alignment tool.
This lecture is partly based on the NCBI education web site
Log-odds Substitution Matrices for Scoring Amino-Acid
Alignments

Everytime we do an alignment of two or more sequences we are making an statement about a biological relationship between the sequences. This can be evolutionary or functional. Indeed, during evolution, sequences change by mutations, insertions and deletions. The evolutionary relationshipts between two or more sequences can be recovered by aligning sequences. The relationship between the sequences can be measured in terms of a degree of "proximity" or "similarity". This measure, as explained below, is based on the observed substitution properties between residues (aminoacids or nucleotides).
Given a pair of aligned sequences, we want to assign a score to the alignment that gives a measure of the relative likelihood that the sequences are related as opposed to being unrelated. We do this by having models that assign a probability to the alignment in each of the two cases, and then we compare these two probabilities.
Consider qi,j the probability that amino acid i transforms into amino acid j and pi as the frequency of amino acid i. We want to compare these probabilities, to determine whether an alignment of two residues is functionally meaningful. Accordingly, we define a number Mi,j called the log-odd ratio, which gives a measure of the likelihood of two aminoacids being related:

In general, the background model pi (also called unrelated or random) is calculated from the data set. Alternatively we can assume a homogeneous distribution:

since there are 20 aminoacids.
The number qi,j can be thought of as the probability that two residues have each independently derived from some unknown original residue in their common ancestor. The simplest model would be an identity model for which:


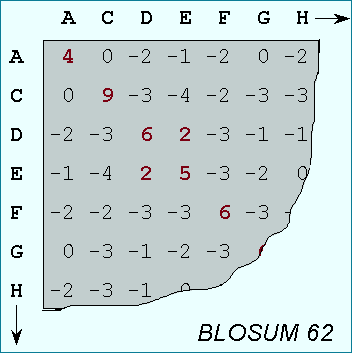
A substitution matrix for aminoacids is a 20 x 20 matrix in which for every pair of aminoacids we assign a log-odd score based on the observed frequencies of such occurences in alignments of related proteins. Identities are assigned the most positive scores. Frequently observed substitutions also receive positive scores and seldom observed substitutions are given negative scores.
PAM-matrices:

BLOSUM matrices with higher numbers and PAM matrices with low numbers are both designed for comparisons of closely related sequences. BLOSUM matrices with low numbers and PAM matrices with high numbers are designed for comparisons of distantly related proteins.
The BLAST Search Algorithm

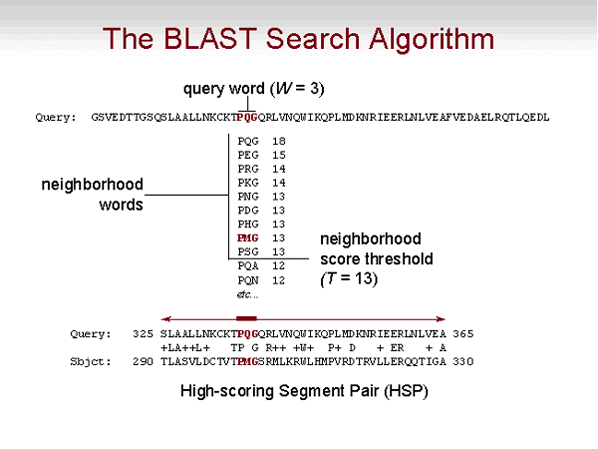
BLAST looks for word matches between the query and the target. These are short segments of length W, typically W is 3 to 5 aminoacis long (about 11 nucleotides for DNA-DNA comparison) which are first read from the query and stored. BLAST then looks for word matches in the target with score T or greater when aligned with the query word, where the score is computed with a substitution matrix. Words in the database (target) that score T or greater are 'seed alignments', which are subsequently extended in both directions until the maximum possible score for the extension is reached. Each alignment built in this way is a high-scoring pair or HSP. The minimum score (S) for the reported HSPs and the maximum allowed expected value (E) of the HSPs can be specified by the user. HSPs that meet these criteria will be reported by BLAST. Additionally, the user can also specify the maximum number of reported 'found targets' (B) and HSPs (alignments) (V). Note that there can be more than one alignment per target. Follow the practical for more details
Flavours of Blast
| Program | Description |
| BLASTP | Compares an amino acid query sequence against a protein sequence or a database. |
| BLASTN | Compares a nucleotide query sequence against a nucleotide sequence or a database. |
| BLASTX | Compares a nucleotide query sequence translated in all reading frames against a protein sequence or a database. This option is useful to find potential translation products of an uncharacterized nucleotide sequence. |
| TBLASTN | Compares a protein query sequence against a nucleotide sequence or a database dynamically translated in all open reading frames. |
| TBLASTX | Compares the six-frame translations of a nucleotide query sequence against the six-frame translations of a nucleotide sequence or a database. The TBLASTX program is the most computationally intensive. It is useful when trying to find distant homologies between coding DNA sequences. |
Some homologies are better found at the AA level. Consider the following two sequences:
A G G T A C T T A C C G
  |   | |     |   | |
C G A T A T A T C C C T
They have very few matches. However, using TBLASTX, we would see that they are possibly homologous:
A G G T A C T T A C C G
 Arg   Tyr   Leu   Pro
  |     |     :     |
 Arg   Tyr   Ile   Pro
C G A T A T A T C C C T
Three aminoacids coincide and the fourth pair has similar biochemical properties. The codon table is:
            3 Letter   1 Letter       DNA codons for each Amino
Acids
NAME    Abbreviation  Abbreviation

Alanine         Ala       A 		GCA,GCC,GCG,GCU
Cysteine        Cys       C		UGC,UGU
Aspartic Acid   Asp       D		GAC,GAU
Glutamic Acid   Glu       E		GAA,GAG
Phenylalanine   Phe       F		UUC,UUU
Glycine         Gly       G		GGA,GGC,GGG,GGU
Histidine       His       H		CAC,CAU
Isoleucine      Ile       I		AUA,AUC,AUU
Lysine          Lys       K		AAA,AAG
Leucine         Leu       L		UUA,UUG,CUA,CUC,CUG,CUU
Methionine      Met       M		AUG
Asparagine      Asn       N		AAC,AAU
Proline         Pro       P		CCA,CCC,CCG,CCU
Glutamine       Gln       Q		CAA,CAG
Arginine        Arg       R		CGA,CGC,CGG,CGU,AGA,AGG
Serine          Ser       S		UCA,UCC,UCG,UCU,AGC,AGU
Threonine       Thr       T		ACA,ACC,ACG,ACU
Valine          Val       V		GUA,GUC,GUG,GUU
Tryptophan      Trp       W		UGG
Tyrosine        Tyr       Y		UAC,UAU

Stop Codons               .             UAA,UAG,UGA
From a search with BLAST we obtain a series of sequence alignments, each one with a similarity score. However, an important issue is how to know the statistical significance of such a score. This significance is based in the probability that two random sequences can have the same score as two real sequences that exceed the expected score (above average). In other words, when we align two sequences, we are actually testing whether this alignment occurred by chance or that the two sequences are truly homologous.
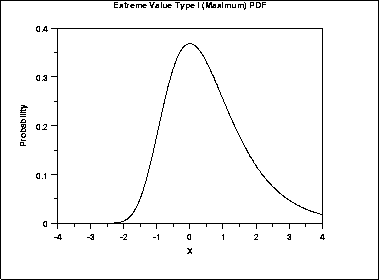
If we perform some sort of comparison between one object and a set (database) of objects, each comparison results in a score. The resulting scores follow a normal distribution (for global alignments), i.e. the sum of many random variables is distributed normally. On the other hand, if for each possible comparison we only draw the maximum score, the results will follow an extreme value distribution (EVD). In sequence alignments, for each comparison we retrieve only the optimal alignment, i.e. the maximum score, hence the results from the sequence comparisons are distributed according to an EVD:

From this distribution, a given a similarity threshold (i.e. a minimal percentage identity) a p-value can be calculated:
P-value: The probability of observing an alignment with equal or greater similarity given the null hypothesis, i.e. how likely is to observe this sequence similarity by chance? The p-value gives us an idea of how likely is that BLAST is producing an alignment between two sequences that are not functionally related.
The higher the p-value the less significant the result. The most common thresholds are 0.01 and 0.05. A threshold of 0.05 means you are 95% sure that the result is significant. The threshold to choose will depend upon the costs associated with making a mistake, like for instance, performing expensive experimental validation, making clinical treatment decisions, etc.
When performing a database search, we are in fact performing multiple tests. The p-value must then be adjusted for these multiple comparisons. Indeed the probability must be modified by the size of the database. This defines the E-value.
E-value. The E-value is a version of the p-value that is corrected for multiple tests. The E-value is computed by multiplying the p-value times the size of the database. The E-value is the expected number of times that the given score would appear in a random database of a given size. For example, for a p-value of 0.001 and a database of 1,000,000 sequences, the corresponding E-value is 0.001 x 1,000,000 = 1,000.
The E-value can be interpreted as the expected number of distinct alignments (HSPs) that we would obtain with a score greater or equal to a given value, by chance, in a database search. The higher the E-value, the less significant the match.
For instance, an e-value of 2 means that we expect 2 alignments to occur just by chance for the given score. Similarly, an e-value of 0.01 means that we expect one random match in every hundred for the given score. Setting a low threshold for the e-value would reduce the number of potential errors. This, however, could also reduce the sensitivity of our search. Typically we will use an E-value threshold of 0.01 or smaller.
The E-value depends on the size of the database (the p-value does not!).
More details about the statistics of BLAST can be found in the NCBI
BLAST
Tutorial.
In this practical we will study the homology relations of the following human protein NP_954673
In a new browser go to the Ensembl web site: www.ensembl.org and clik on the Blast button (on the left).
Question. There is only one possible BLAST type to use, try you understand why. Question. What is the meaning of the following parameters?
Question. What happens if we change the value of W?
Changes in the parameters permit a tradeoff between speed and sensitivity. For instance, a higher T would increase speed but it could miss weak similarities. A larger W will provide a faster search, but we will lose sensitivity.
The alignment results will look like this:
Query                 Subject                       Genome
Stats
Name    Start End Ori Name            Start End Ori Name      Start End     Ori Score E-val   %ID   Length
NP_954673 228 370 +   ENSRNOP00000002504  3 145 +   Chr:11 87256459 87287530 +  642   1.1e-64 85.31 143
NP_954673 240 311 +   ENSRNOP00000013486 34 102 +   Chr:10 59509455 59576068 +  122   2.1e-07 40.28  72
NP_954673 232 351 +   ENSRNOP00000006751  1 113 +   Chr:10 37517408 37530229 -  105   4.9e-06 24.79 121
...
Concentrate on the best match:
Repeat the search using all Ensembl peptides (known and novel). Look at
the difference in e-values.
Try now to search for homologies using the same query but searching
against the cDNA sequences.
This exercise must be done in Linux. To use the BLAST package from NCBI from the computers in the class copy paste the following commands in the shell:
$ export PATH=/cursos/20428/BI/soft/ncbiblast/blast-2.2.26/bin/bin/:$PATH
We can use blast in command line. The three basic things to specify to the balst command is the name of the query, the name of the target (database) and the type of blast to run.
Type blastall in the command line to find out about the different options.
Question:Can you locate the same options that we have seen previously?
First of all, we need to "format" the database. That is, we need to pre-process the database for the blast run. We do this with the command formatdb:
formatdb -i sequences.fa
sequences.fa.phr sequences.fa.pin sequences.fa.psq
look at the options of formatdb typing "formatdb -".
We are now ready to run BLAST in command line. The basic command is:
blastall -p program_name -d database -i query_file
where
We want to use the following protein query:
>Cele_RSP2
MVRVYIGRLPNRASDRDVEHFFRGYGKLSDVIMKNGFGFVDFQDQRDADDAVHDLNGKEL
CGERVILEFPRRKVGYNEERSGSGFRGREPTFRKGGERQFSNRYSRPCSTRFRLVIDNLS
TRYSWQDIKDHIRKLGIEPTYSEAHKRNVNQAIVCFTSHDDLRDAMNKLQGEDLNGRKLK
CTDETRDRSRSRSPRRRSRSRSPTRSRSPPARRRSPGSDRSDRKSRSASPKKRSDKRARS
ESKSRSRSGGRRSRSNSPPNRSPSPKKRRDNSSPRSGSASP
store this sequence into a file (e.g. Cele_RSP2.fa). We are now ready to perform a BLAST with this query in our database:
blastall -p blastp -d sequences.fa -i Cele_RSP2.fa
to be able to see the results you can write:
blastall -p blastp -d sequences.fa -i Cele_RSP2.fa | more
We can restrict our alignments setting a threshold for the E-value. For instance:
blastall -p blastp -d sequences.fa -i Cele_RSP2.fa -e 0.01
This helps us filtering out non-significant matches from our output.
We may restrict our searches only to regions of ungapped similarity:
blastall -p blastp -d sequences.fa -i Cele_RSP2.fa -g F
Now try with a human homologue:
>Hsap_SR40
MSGCRVFIGRLNPAAREKDVERFFKGYGRIRDIDLKRGFGFVEFEDPRDADDAVYELDGK
ELCSERVTIEHARARSRGGRGRGRYSDRFSSRRPRNDRRNAPPVRTENRLIVENLSSRVS
WQDLKDFMRQAGEVTFADAHRPKLNEGVVEFASYGDLKNAIEKLSGKEINGRKIKLIEGS
KRHSRSRSRSRSRTRSSSRSRSRSRSRSRKSYSRSRSRSRSRSRSKSRSVSRSPVPEKSQ
KRGSSSRSKSPASVDRQRSRSRSRSRSVDSGN
Question:Can you see the multiple "X"s? Use the option -F F and see what happens with the "X"s.
Question:Do you see a difference in the number of results? Can you understand why?
Now we try to compare the same protein with the same list of genes, but this time we use the cDNA sequences for these genes. In this file: cDNA_sequences.fa you can find the cDNA sequences corresponding to the previous protein set.
Format the datbase as before (now we have to specify that we are formatting a nucleotide database):
formatdb -i sequences.cds -p F
sequences.cds.nhr sequences.cds.nin sequences.cds.nsq
We are now ready to run BLAST in command line as before:
blastall -p tblastn -d sequences.cds -i Cele_RSP2.fa
Question: Do you find more or less results than before?
There is an option that allows you to change the genetic code when using TBLASTN and TBLASTX:
-Q (genetic code of the query)
-D (genetic code of the database)
For instance:
blastall -p tblastn -d sequences.cds -i Cele_RSP2.fa -D 1
Go to the BLAST tutorial page and check the different genetic codes that you can use.
BLAST gives you the option to obtain the output in different formats. This is done with the option -m value , where value can take on the following values:
0 = pairwise,
1 = query-anchored showing identities,
2 = query-anchored no identities,
3 = flat query-anchored, show identities,
4 = flat query-anchored, no identities,
5 = query-anchored no identities and blunt ends,
6 = flat query-anchored, no identities and blunt ends,
...
(defalut 0)
Try the values 4 and 6. Try to understand what they show.
PARSEBLAST
We can also use the program parseblast. This is a PERL program written by Josep Abril, which allows you to convert the standard blast output (option -m 0) into different formats.
./parseblast -helpto see the description and the different options
blastall -p blastp -d sequences.fa -i Cele_RSP2.fa -e 0.01 |
./parseblast -P
The program blastcl3 allows to make a blast search using a database from the NCBI server. Basic command line:
blastcl3 -p program_name -d database -i query_file -e E-value
where
For the complete list of parameters, type blastcl3 in the command line.
run the query "Cele_RSP2" against "nr" remotely.
Note:You can use the same parameters for output as before.
Note:"NR" is a big database, this may take a while.
There is a list of protein and nucleotide databases available to run blast remotely. Look in the BLAST help pages for the list of available databases. Tryy using one of them.